HTML Preview
Ask for a chart or table and review the live preview when it appears.
Overview
HTML Preview shows charts, tables, and simple visual layouts directly inside your chat instead of only text. Use it when you have numbers or comparisons and want to see them as a bar chart, line chart, or formatted table quickly. Describe the visual and include your data in the message; when the preview is ready you can review it, copy the HTML code with one click, or download the output.
End-to-end flow
A simple path to follow:
Open Tools → Select HTML Preview → Describe the chart or table and paste your numbers → Send → Review the rendered preview → Copy HTML with one click or download the output → Ask to change chart type or labels if needed
How it works
Provide numbers:
Include the actual figures in your prompt — month names, sales values, percentages — so the chart reflects your data instead of placeholder examples.
Copy HTML:
Use the one-click copy control on the preview to copy the HTML code when you need it in another tool or page.
Download output:
Download the generated output so you can keep the chart or visual for decks, emails, or records.
Iterate:
You can ask to switch from bar to line chart, rename axes, or highlight one series without retyping all the numbers if they are still in the chat.
Tip:
Example: “Show a bar chart of Q1 sales: Jan 120, Feb 180, Mar 240, with rupee labels on the axis.”
Walkthrough
1. Ask for a visual
Select HTML Preview from Tools, then describe the chart or table you want and paste the numbers or categories in the same message.
Say the chart type if you care — bar, line, pie — and label axes clearly. Click Send; the preview appears in chat when ready.
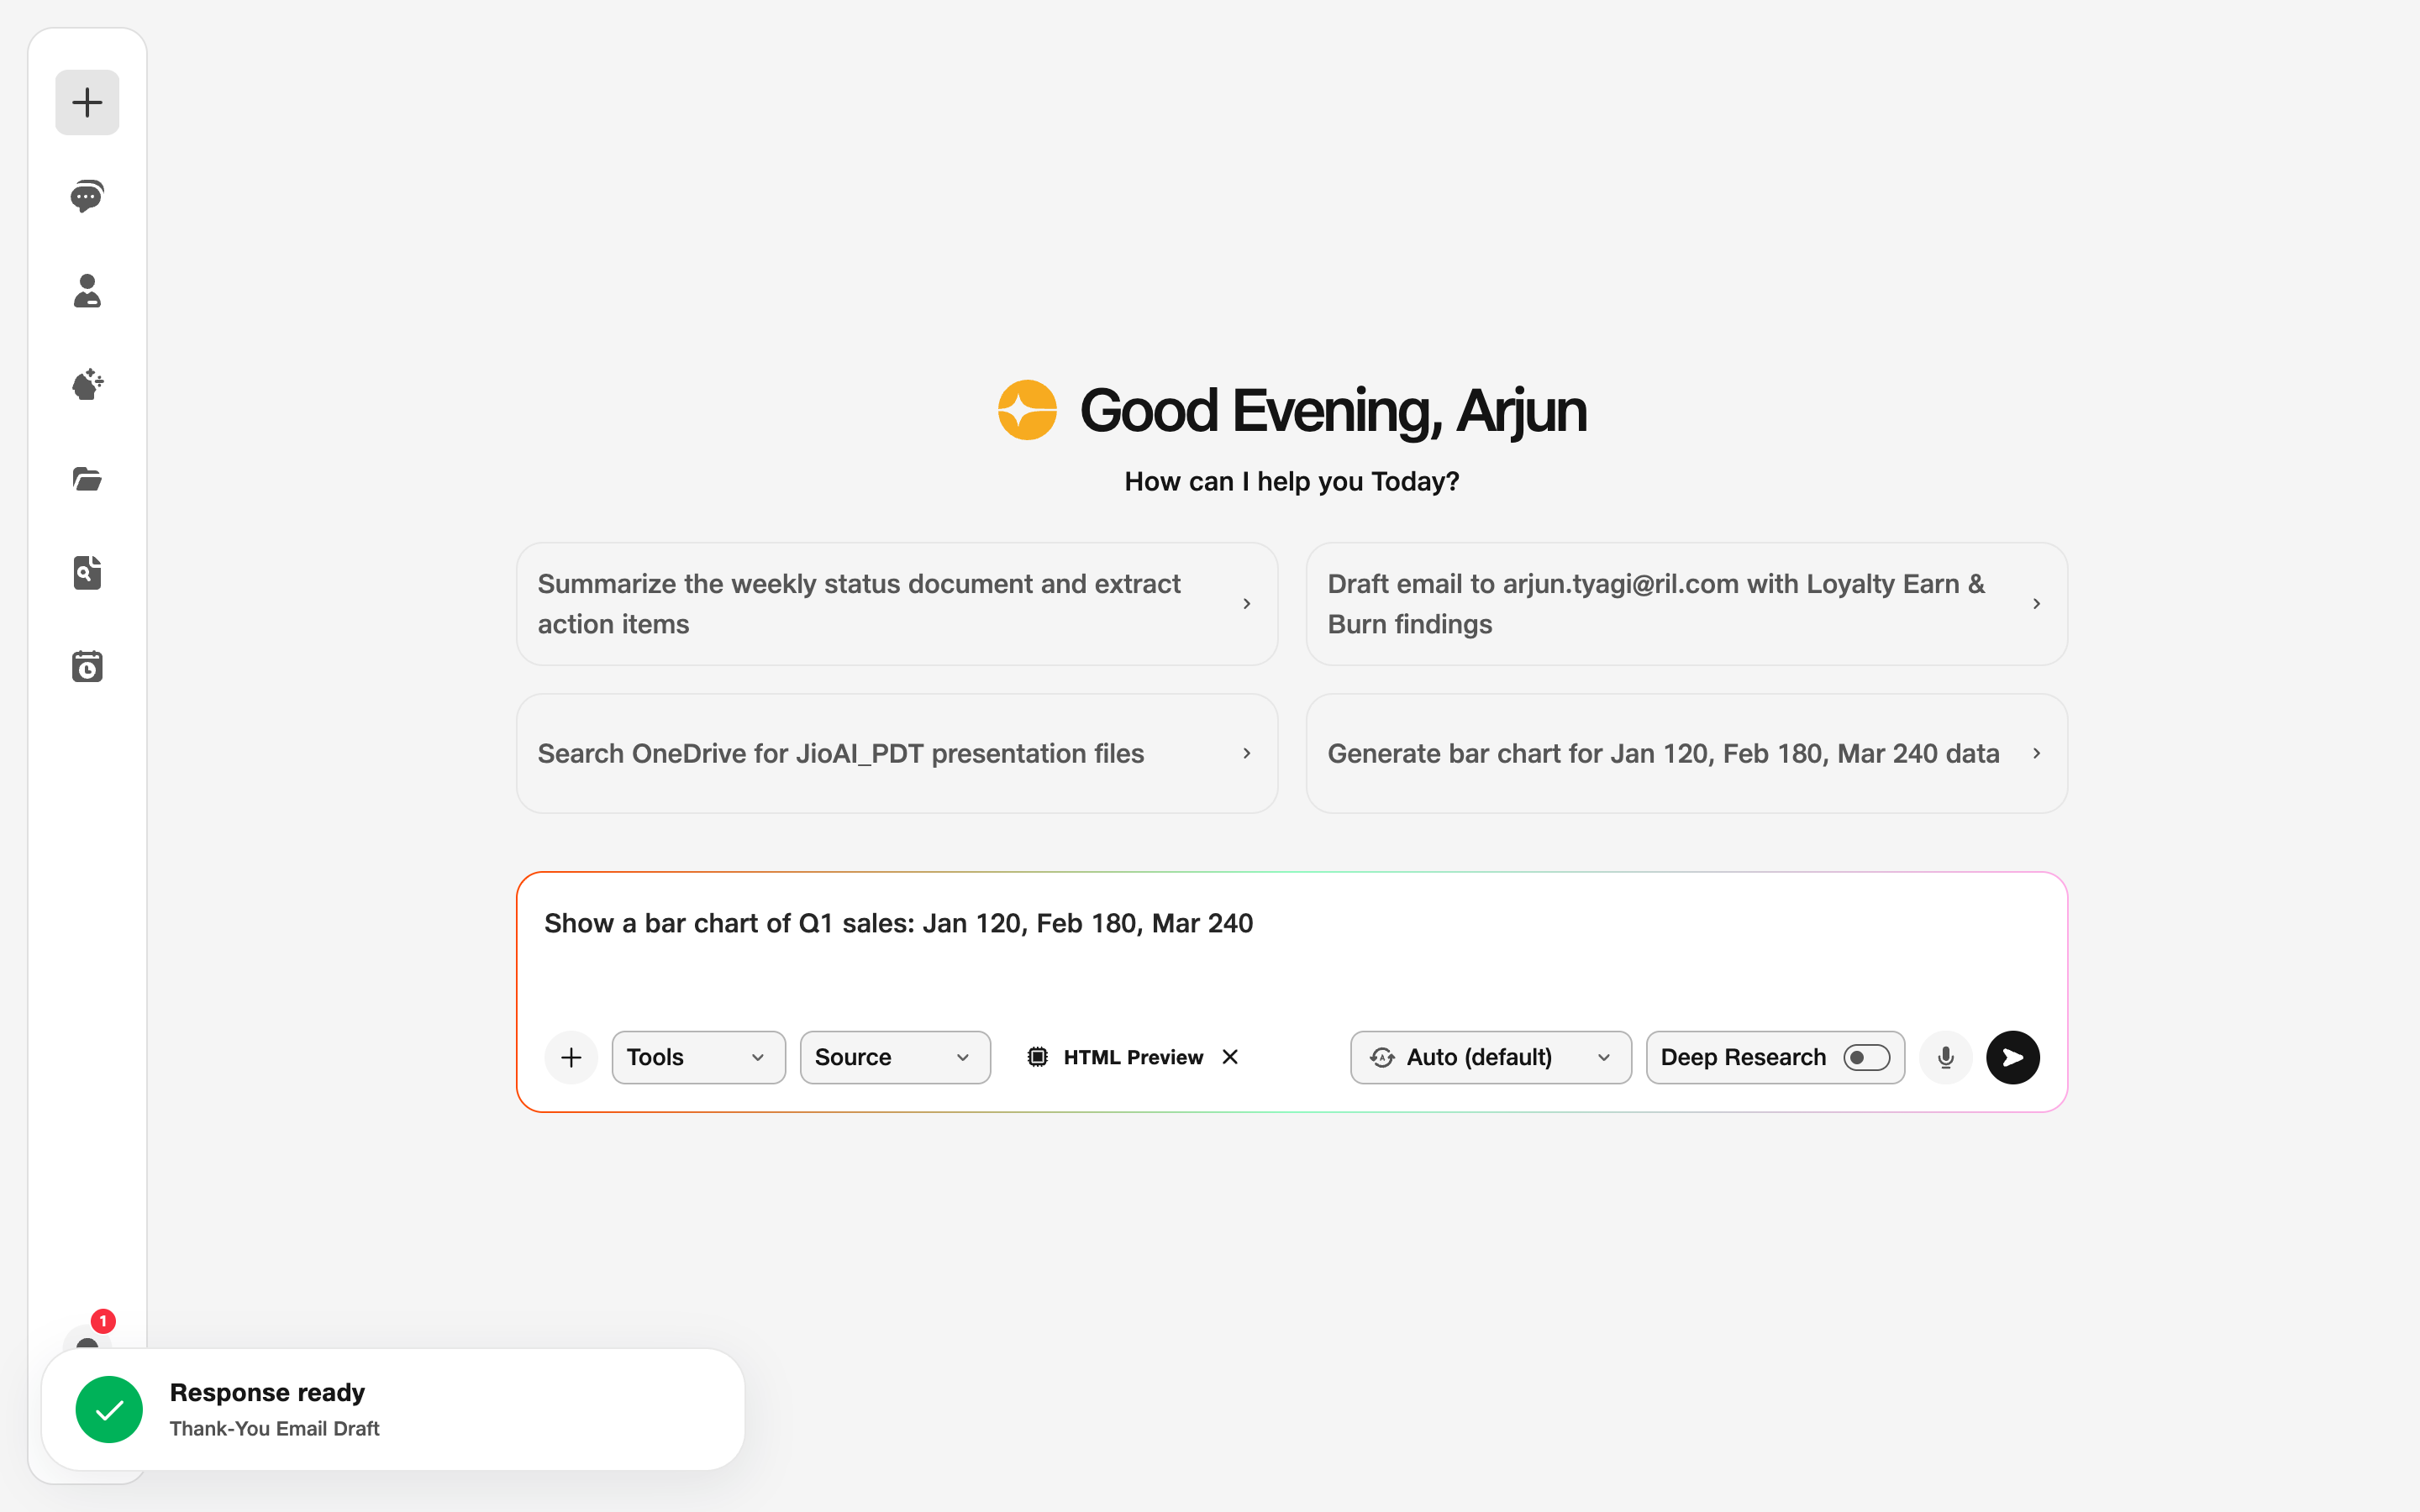
- Data: Numbers make better charts.
2. Final preview
When the preview is ready, a rendered chart or table appears in the chat — check that labels and values match what you entered.
Use one-click copy to copy the HTML code, or download the output for offline use. Reload the preview to refresh the visual. Share the created visual directly from chat. If something is wrong, reply with a fix — “sort months chronologically” or “use a line chart instead” — in the same conversation.
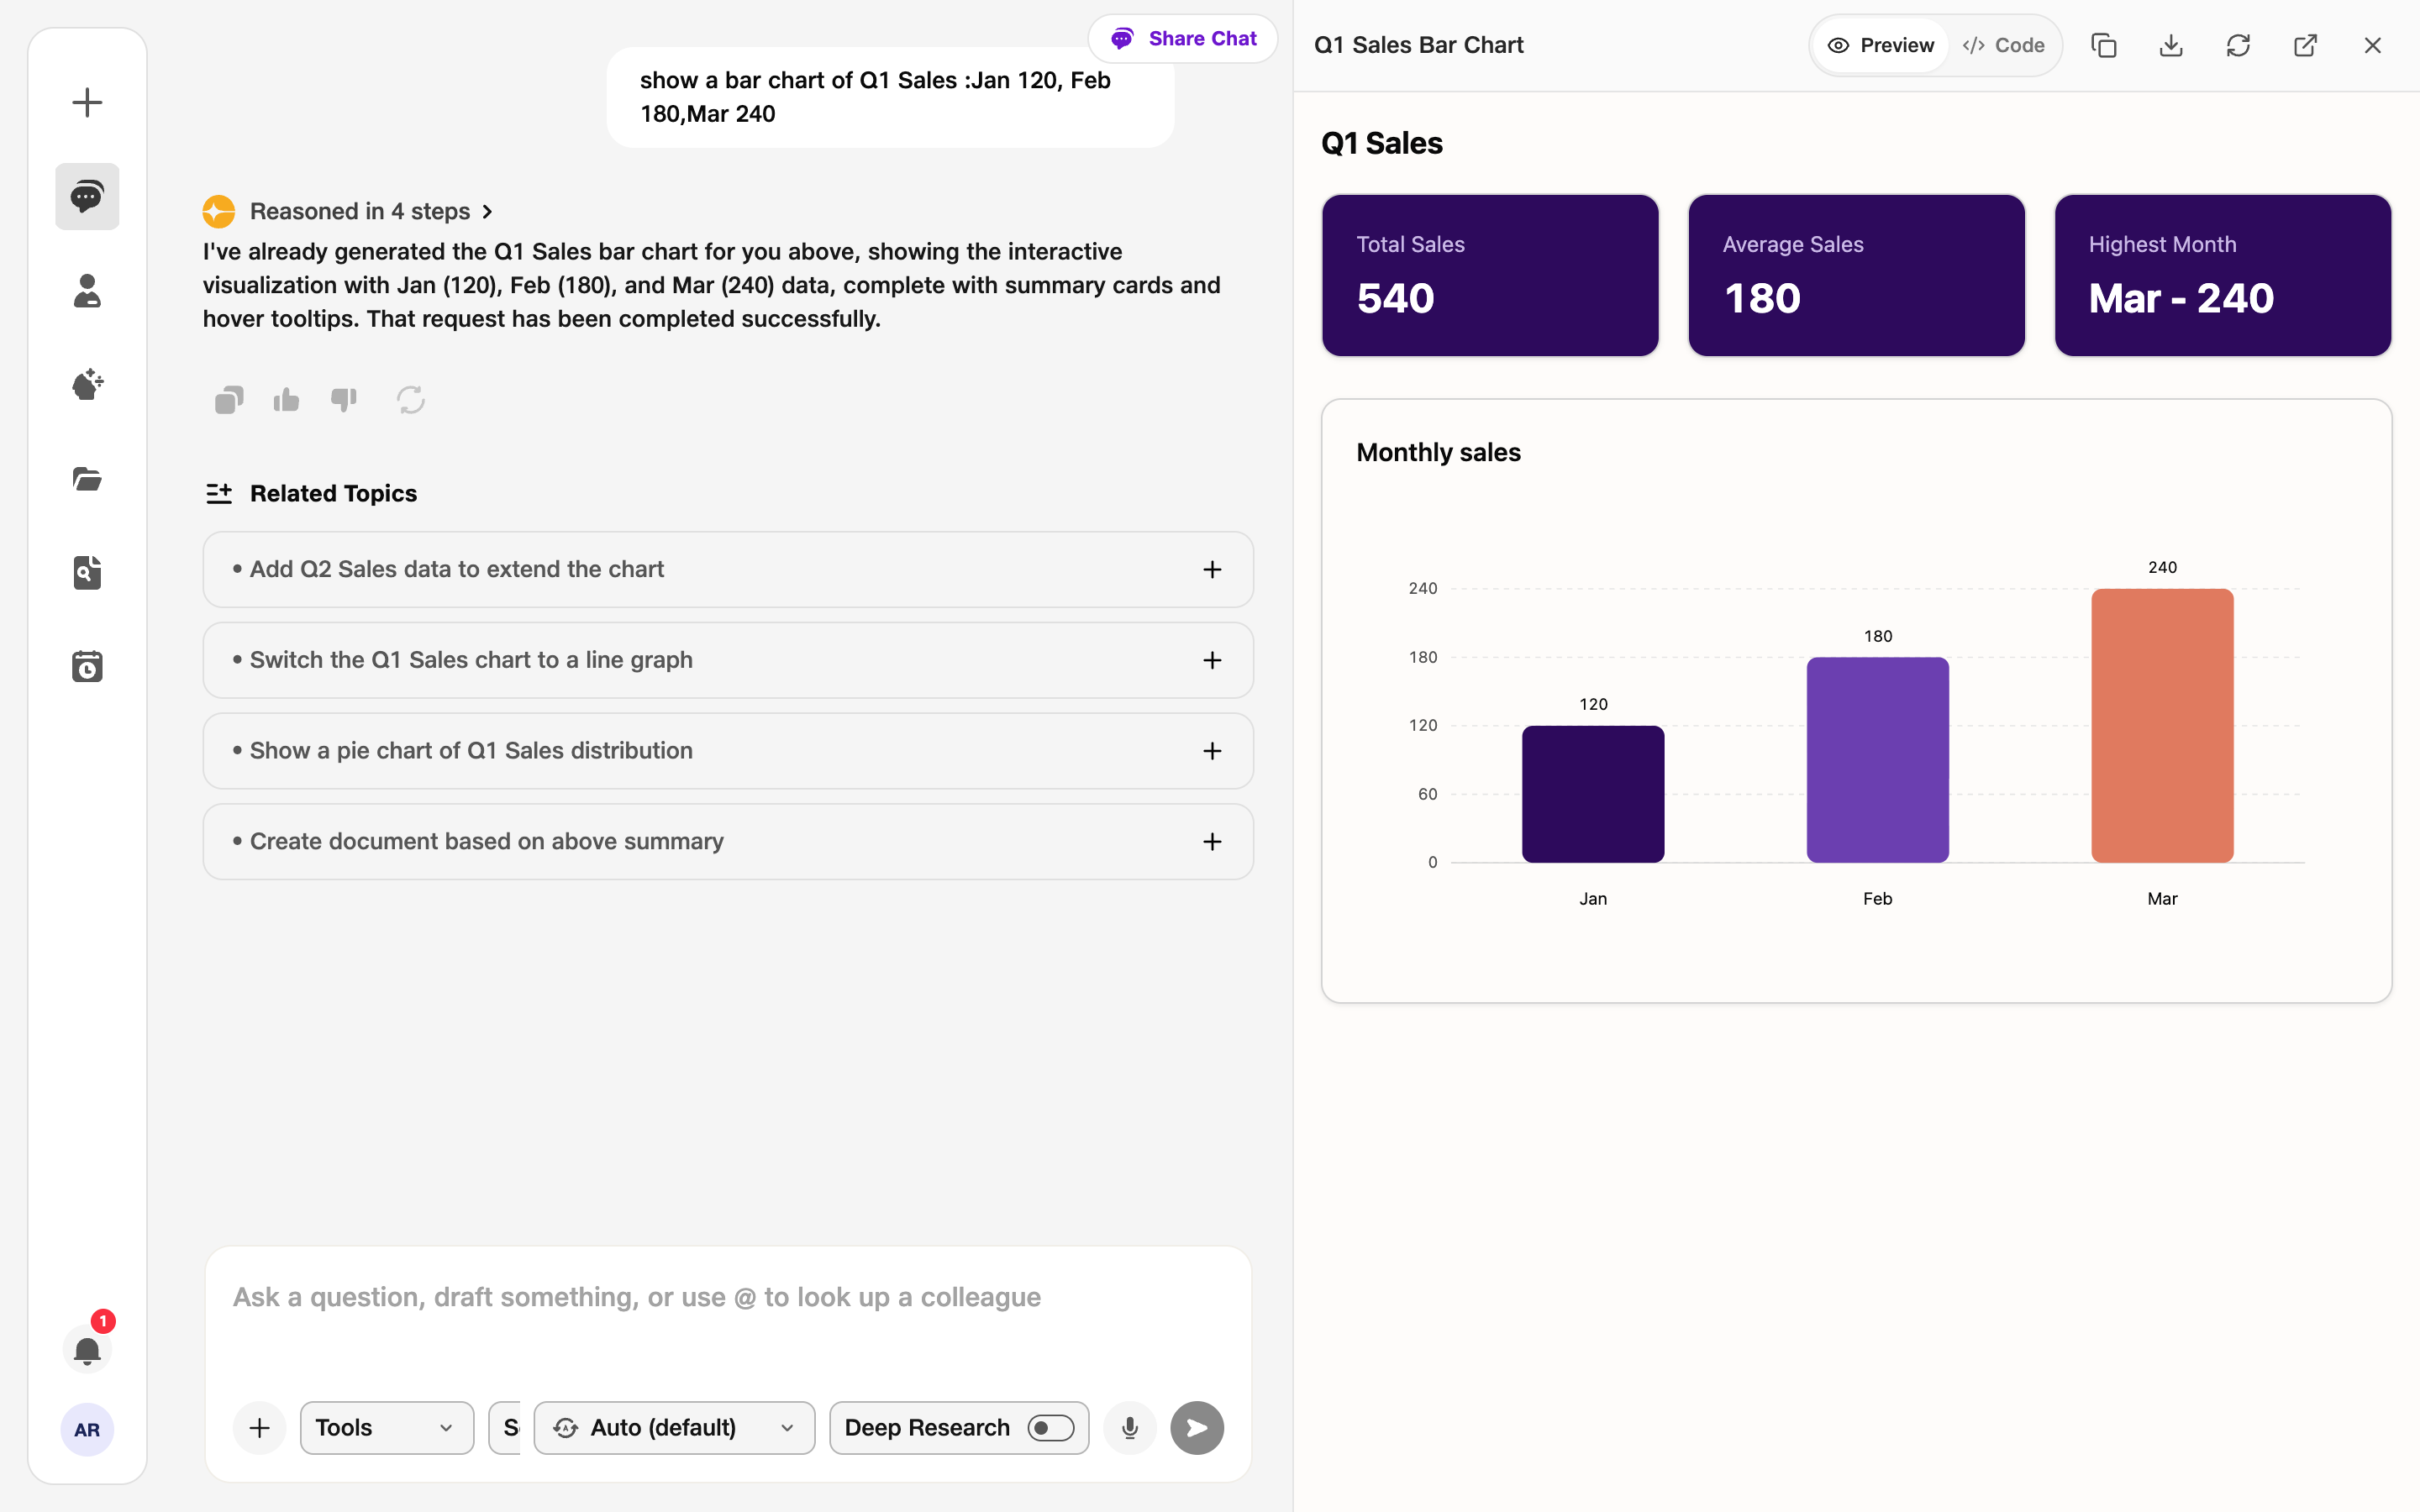
- Preview: Final visual in chat.
- Reload: Refresh the visual.
- Share: Share the created visual directly.